Hydraulic Calculations and Pipe Sizing in Gravity Sewerage Systems
16 lutego 2025 | Sewerage
Guide to flow calculations and pipe diameter selection in gravity sewerage systems according to Polish standards

Designing gravity sewerage systems requires precise hydraulic calculations that consider Polish standards (including PN-EN 12056-2) and local conditions. In this guide, we will step by step discuss the methodology for calculating sewage flow, selecting pipe diameters, and key technical parameters. The article is based on current regulations and practices used in Poland, considering design support tools such as Gravity Pipeline Calculator.
Sewage Flow Calculation
Manning's Formula – Calculation Basics
Flow in gravity pipes is calculated using Manning's formula, which combines pipe geometric parameters with flow velocity:
Where:
- – flow rate ,
- – Manning's roughness coefficient ,
- – flow cross-sectional area ,
- – hydraulic radius (, where – wetted perimeter) ,
- – hydraulic slope (equal to pipe bottom slope in free flow) .
Manning's Roughness Coefficients for Different Materials
| Pipe Material | Value |
|---|---|
| PVC/PE | 0.009–0.011 |
| Concrete | 0.012–0.014 |
| Vitrified Clay | 0.013–0.015 |
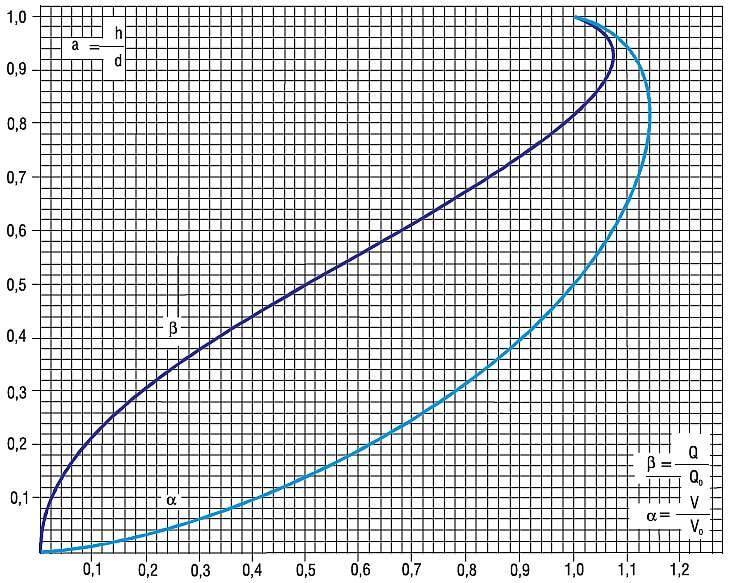
Flow Capacity Curves ("Manning's Leaf")
Theoretical Foundations
Flow capacity curves illustrate the relationship between pipe filling ratio () and the ratio of partial flow () to full flow (). The basic equation for circular sections:
Where:
- – central angle corresponding to filling (in radians),
- – hydraulic radius at partial filling,
- – hydraulic radius at full filling ().

Chart Characteristics
The typical capacity curve resembles a maple leaf shape. Maximum flow occurs at , not at full filling, due to increased hydrodynamic resistance.
Key curve points:
Reference Values Table
| Filling Ratio (h/D) | Q/Q₀ (PVC, n=0.01) | Q/Q₀ (Concrete, n=0.014) |
|---|---|---|
| 0.2 | 0.05 | 0.04 |
| 0.4 | 0.25 | 0.20 |
| 0.6 | 0.60 | 0.55 |
| 0.8 | 0.95 | 0.90 |
| 0.93 | 1.05 | 1.00 |
Calculation Automation
Manual calculations are time-consuming and error-prone. Therefore, we recommend using tools like Gravity Pipeline Calculator, which:
- Considers PN-EN standards and roughness coefficients,
- Generates flow capacity curves ("Manning's leaf") in real-time,
- Optimizes diameters and slopes for self-cleaning.
Summary
Designing gravity sewerage systems requires:
- Flow calculations using Manning's formula,
- Analysis of flow capacity curves for different filling ratios,
- Diameter selection according to minimum standard values.
For complex projects, it's worth using dedicated software, such as our calculator, which will speed up calculations and minimize the risk of errors.
Need support? Check out our tool and optimize your sewerage designs in compliance with Polish regulations!
Back to articles list