
Mollier diagram (i-x) - how to read it and use it in HVAC design practice
24 kwietnia 2026 | Ventilation
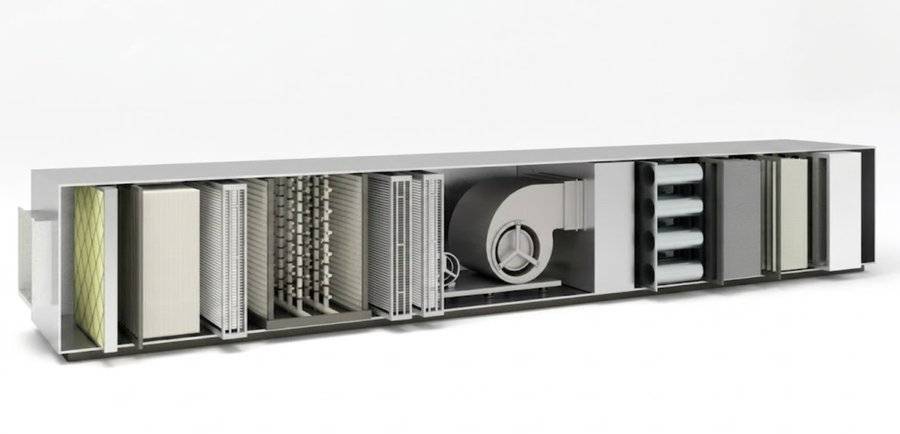
For the HVAC designer, the Mollier diagram is still the fastest way to see, at a single glance, what happens to the air inside an air handling unit, a duct or a room. Instead of juggling formulas for enthalpy, vapor pressure and dew point, it is enough to read the position of a state point and the direction of the line connecting two states. The problem is that the classic printed chart has limited accuracy, does not allow the barometric pressure to be changed, and forces tedious manual redrawing of every new process line.
If you care about quick readouts and automatic calculation of capacity and condensate, go straight to our interactive Mollier diagram - it runs in the browser and recomputes all parameters with a single click on a point.
What is the Mollier diagram and where does it come from
The Mollier diagram (i-x) was developed in 1923 by the German engineer Richard Mollier. It graphically shows the relation between the specific enthalpy of moist air and the humidity ratio at a constant barometric pressure. In Europe it became the standard design tool in ventilation, air conditioning, drying and refrigeration. In the United States the analogous role is played by the psychrometric chart (Carrier / ASHRAE), which has the axes swapped - the horizontal axis shows temperature and the oblique axis shows enthalpy. Both charts carry exactly the same thermodynamic information, so readings taken from a Mollier diagram and from a psychrometric chart are identical.
In practical design work, the name "Mollier diagram" is used as commonly as the short forms "h-x chart" or "i-x chart" - they all refer to the same tool. In the literature enthalpy is denoted sometimes as and sometimes as ; in this article we consistently use the symbol in line with Mollier's original notation.
Chart layout - axes, grid, isolines
At first glance the Mollier diagram looks like a dense tangle of lines, but its logic is very simple. Every point on the chart describes one state of moist air - and all the lines are isolines, that is, the geometric loci of points with a constant value of a selected parameter.
Main axes
The horizontal axis is the humidity ratio expressed in of dry air. The oblique axis (usually inclined at about 135°) is the enthalpy in of dry air. The axis tilt is a deliberate trick by Mollier - it makes lines of constant enthalpy appear as oblique straight lines and allows isenthalpic processes to be easily distinguished from isothermal ones.
Isotherms
Lines of constant dry-bulb temperature look like almost-straight lines tilting gently upwards. Reading the temperature from the chart simply means finding the isotherm on which a given point lies.
Relative humidity lines
Lines of constant relative humidity are concave curves, the most important of them - the saturation line - usually drawn as a thicker line. The region below this line is the so-called fog region: the air then contains more water than it can hold as vapor, and the excess exists as fine liquid droplets. In ventilation design we, as a rule, do not enter the fog region.
Specific volume lines
The grid is completed by lines of constant specific volume in - these reveal to the designer that air density varies with temperature and humidity. The commonly assumed value is only true at standard conditions (20 °C, φ = 50 %, 1,013.25 hPa).
h-x chart vs. i-x chart - is it the same thing?
Yes. The "h-x chart" is simply a notation in which enthalpy is denoted by instead of . Both show the same relations, use the same units and serve the same purpose. In Polish practice the two names are used interchangeably and there is no reason to distinguish them.
Moist air parameters - what exactly are we reading
Every point on the Mollier diagram simultaneously provides seven parameters describing the state of the air. Each of them is required for a different design task. The table below shows what they mean and how they are determined from the chart.
| Parameter | Definition and unit | How to read it on the chart |
|---|---|---|
Temperature | Dry-bulb air temperature, °C | Read from the isotherm passing through the point |
Humidity ratio | Mass of water vapor per kg of dry air, g/kg | Vertical readout on the x-axis |
Relative humidity | Ratio of vapor pressure to saturation vapor pressure, % | Read from the curve |
Enthalpy | Air energy referred to 1 kg of dry air, kJ/kg | Read from the oblique enthalpy axis |
Dew point temperature | Temperature at which vapor starts to condense, °C | Vertically down to the line, then isotherm |
Wet-bulb temperature | Temperature of adiabatic saturation, °C | Along the isenthalpic line (oblique) to |
Density | Mass of 1 m³ of moist air, kg/m³ | From the specific volume line , as |
The basic formula linking enthalpy with temperature and humidity ratio (at atmospheric pressure), where in the formula is substituted in kg/kg (that is, the readout from the chart in g/kg is divided by 1,000):
The term is the enthalpy of dry air. The constant 2501 kJ/kg is the latent heat of vaporization of water at 0 °C, and [kJ/kg] describes the additional energy of water vapor resulting from its temperature (the product of the specific heat of vapor 1.86 kJ/(kg·K) and the temperature ).
Humidity ratio from relative humidity and pressure:
where is the saturation vapor pressure at a given temperature (determined, for example, from the Magnus equation), and is the barometric pressure. As can be seen, the expression for explicitly contains - and that is why a printed chart can be misleading outside standard conditions. In our Mollier diagram calculator, all seven parameters are computed simultaneously and is entered from the form - this is critical if you are designing an installation at a high altitude above sea level or at an unusual duct pressure.
How to find the dew point on the chart?
The dew point is one of the values most frequently sought by the designer - it determines the choice of cooling coil surface temperature, pipe insulation and the risk of condensation on installation elements. The procedure on the Mollier diagram is always the same: from the state point you go vertically downwards (that is, at constant humidity ratio ) to the saturation line , and then read the temperature from the isotherm that this line crosses. Physical interpretation: the vertical drop means cooling the air without changing the amount of water it contains - at the moment it touches the saturation line, water begins to condense.
Six key air processes
In design practice, most calculations boil down to six typical thermodynamic processes. Each of them is a line segment on the chart with a characteristic direction - and that direction is what matters most.
1. Heating (dry)
Supply of heat without change of humidity ratio. On the chart this is a vertical upward segment (constant , rises, rises, drops) - moisture does not appear out of nowhere, so must remain constant. Typical application: preheating or reheating coil in an air handling unit. The heating capacity follows from the enthalpy rise of the stream.
2. Dry cooling
Removal of heat without condensation. A vertical downward segment (constant , drops, drops, rises). Condition: the cooling coil surface temperature must be higher than the dew point of the incoming air - otherwise the process stops being dry.
3. Cooling with dehumidification (wet coil)
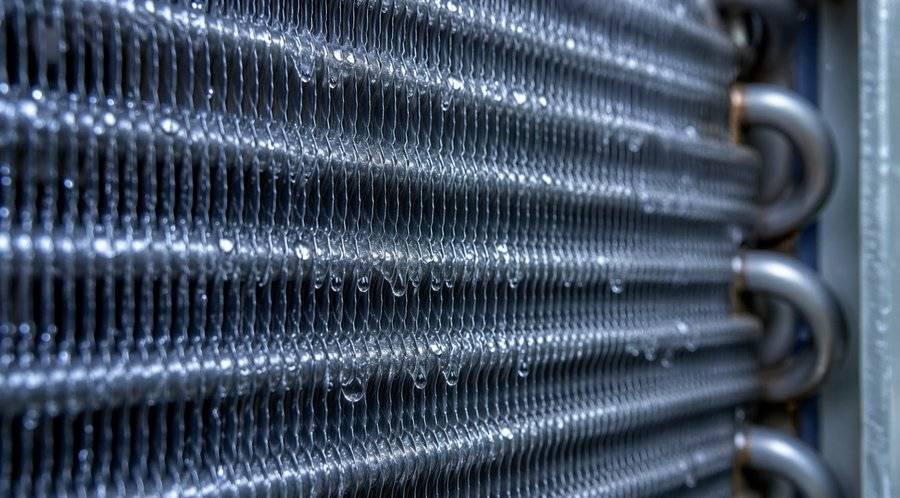
When the coil surface temperature drops below the dew point, water condenses on the fins and the air stream leaves the coil with a lower humidity ratio. On the chart this is a curve leading to low temperature and high , ending near the saturation line. The coil capacity consists of two components: sensible heat (temperature drop) and latent heat (water condensation). Balancing both by hand is tedious - in the Mollier diagram calculator it is enough to mark the inlet and outlet points, and the system reports both the total capacity and the condensate flow rate.
4. Adiabatic humidification (water-based)
Spraying the air with water at a temperature close to the wet-bulb temperature. The water evaporates at the expense of the heat of the air itself - hence the process follows almost exactly a line of constant enthalpy (obliquely downwards and to the right: drops, rises). This is the most commonly misunderstood process - many beginner designers confuse the direction, thinking it means isothermal humidification.
5. Steam humidification (isothermal)
Injection of water vapor at high temperature. Because steam carries a lot of energy, the air temperature hardly changes - the process runs almost along an isotherm to the right ( rises, rises). Used in precision air conditioning (server rooms, process rooms).
6. Mixing of two streams
Combining fresh outdoor air with recirculated air. The mixture point lies on the straight line connecting the two state points, and its position is determined by the lever rule - dividing the segment in the inverse proportion of the mass flow rates. The lever rule fails when the two streams have noticeably different barometric pressures (e.g. after a compressor) - then they must be mixed using enthalpy and mass balances, not vectorially.
Process direction factor
Each process can be assigned a direction factor:
This number tells you how much energy flows per gram of humidity change and makes it possible to draw the direction of the process on the chart even before its end point is known. In the selection of cooling coils and humidifiers, (also called the sensible-to-total heat ratio) answers directly the question "how much of the device capacity goes into cooling, and how much into dehumidifying the air".
Practical example: heating outdoor air in winter
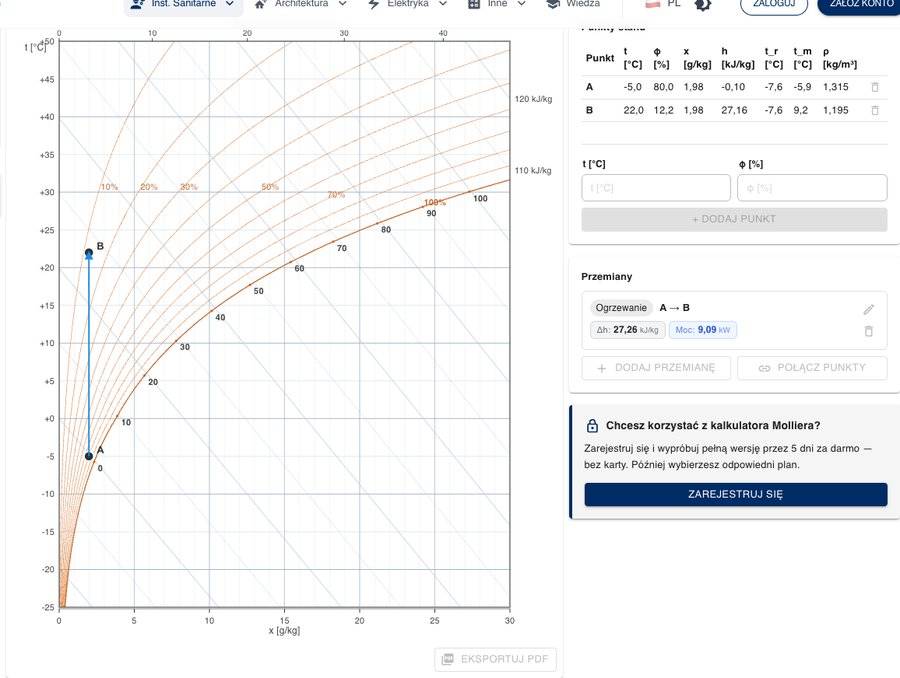
Consider a typical winter day in the Polish climate and a supply air handling unit with a reheat coil. Design parameters:
- Point A (outdoor air): °C,
- Point B (required supply air after the coil): °C
The process is dry heating - a vertical upward arrow at constant (moisture does not appear, so ). The rest of the parameters are a matter of consistent readout from the chart. By marking both points in the calculator you immediately get the full list:
- humidity ratio ,
- inlet enthalpy , outlet ,
- enthalpy difference ,
- heating coil capacity for the default airflow ,
- relative humidity after heating , dew point °C.
In summer the same air handling unit works with a cooling coil. The starting point moves to the upper right (e.g. 30 °C, 50 %), and the process runs along a curve downwards to the required supply conditions. If the coil surface temperature is lower than the dew point of the incoming air, part of the moisture condenses - and then the coil capacity splits into sensible and latent heat. The balance is calculated in exactly the same way as in winter, only the direction factor has a different sign.
Common design mistakes
The Mollier diagram is easy to read, but it is surprisingly easy to make a mistake on it that will come back to haunt you during installation. Here are the most common traps that even experienced designers fall into.
Confusing dew point with wet-bulb temperature
These are two different temperatures. The dew point is determined vertically downwards to the line, while the wet-bulb temperature is determined obliquely along the isenthalpic line. The values coincide only when the air is already saturated. Confusing them in cooling coil calculations results in incorrect selection of capacity and coolant temperature.
Ignoring condensation
Calculating the cooling capacity only as (sensible heat) ignores water condensation. In a real summer cooling coil, latent heat can represent 30-50 % of the total capacity - ignoring it leads to undersizing the device.
Wrong direction of the adiabatic process
The direction of adiabatic humidification is often confused - beginner designers draw it along the isotherm instead of the isenthalpic line. As a result, the temperature after the humidifier comes out higher than the real one, and the reheat coil is designed too small.
Lever rule at different pressures
Graphical mixing of streams using the lever rule assumes the same barometric pressure for both streams. In compressed installations (e.g. downstream of a high-pressure fan) or in industrial applications this condition is not met - streams must be mixed using mass and energy balances, not graphically.
Outdated barometric pressure
The printed chart is drawn for hPa. In Zakopane (approx. 900 hPa) the same temperature and relative humidity yield a different humidity ratio and different enthalpy. For mountain projects and industrial installations operating at elevated pressure, use a calculator in which can be set freely.
Fixed density of 1.2 kg/m³
Many designers consistently assume when converting volumetric flow rates to mass flow rates. The Mollier diagram shows directly that density varies by more than ten percent across the typical parameter range - from about 1.40 kg/m³ in a harsh winter to 1.14 kg/m³ in a hot summer. In large air handling units this error can mean a difference of several hundred watts in capacity.
Related topics and standards
The Mollier diagram is an auxiliary tool - on its own it does not replace design calculations. In the full documentation you must refer to:
- EN 16798-1 - indoor air quality requirements (temperature, humidity, fresh air flow per person),
- PN-B-03421 - ventilation and air conditioning in rooms with special requirements,
- Polish Technical Conditions regulation (WT) - regulation on the technical conditions to be met by buildings (requirements for ventilation, exhaust airflows in kitchens, bathrooms, boiler rooms).
Once you have determined the air parameters from the Mollier diagram, if you then need to calculate the supply airflow, start with the article How to calculate the airflow in ventilation. The selection of duct diameters based on that airflow is shown in the guide Ventilation duct sizing. A comparison of natural ventilation with mechanical ventilation with heat recovery can be found in the article Recuperation vs. natural ventilation.
Summary
The Mollier diagram is one of those tools that look complicated but become intuitive after a dozen or so minutes. The key is to remember that every point is one state of air, and every process is a segment with a characteristic direction - vertical for heating, oblique for adiabatic humidification, curved for condensation. The seven parameters that can be read from a single point cover practically all the moist air thermodynamics a designer needs.
The problem with the paper chart is its limited accuracy, one fixed barometric pressure and the need to manually redraw every new process. That is why, instead of copying printouts and catching lines with a compass, launch our interactive Mollier diagram - set , click the inlet point and the target point, and the system will draw the process, calculate the capacity, condensate flow and direction factor on its own. The same tool in a project, in an hour rather than half a day.
Back to articles list